03/05/2024 • 7 Minute Read
Using Hypothesis Testing to Determine if Temperature Impacts Workout Performance
How to use Python and the Statsmodel package to run hypothesis tests to determine if temperature and humidity impacts workout performance

Data Science
Hypothesis Testing
Python
Statsmodels
Gym Workout
Problem Motivation and Dataset
One of my hobbies outside of work is weight lifting. I would say I take it somewhat seriously, and enjoy a mixture of both strength (high weight) and hypertrophy (high repetition) training.
During this past summer I realised (particular on leg days), that if it was quite hot I would feel weaker and lift less weight and repetitions.
As such, I wanted to check if there was actually a significant difference between “gym performance” between hot and regular days, so that if there is I can prepare better (increase hydration, go earlier/later in the day, etc).
To do this, I used a spreadsheet where I tracked my repetitions, weight and RPE for every set of every workout I’ve done. I combined this dataset, with my Apple Health data which records the temperature and humidity of each workout recorded in the “Fitness” app.
I’ve created a dataset from cleaning and processing the aforementioned data which you can find on Github here along with the completed Jupyter Notebook for the following experiments.
The “exertion score” is simply the sum of product of repetitions, weight and RPE for each set for a given workout:
Where n is the number of sets, i is the index of the current set, R is number of repetitions, W is the weight used and E is RPE.
Defining the Hypothesis for the Problem
Defining your hypothesis so it can be tested and proven “correct”, can be slightly confusing but there are steps you can follow it define it properly.
My original hypothesis is that on average, exertion score (workout performance metric) is higher on regular days than it is on hot or humid days (temperature and humidity will be tested separately).
However, we cannot directly prove a hypothesis to be true, rather we can prove a negation (opposite) of the hypothesis to be false. Thereby, implying the original hypothesis is true.
Hence a new hypothesis is needed, which if rejected implies the original hypothesis is correct. This “new hypothesis” is formally referred to as the Null Hypothesis. In our case:
- Null Hypothesis (): mean exertion score on hot days is greater than the mean exertion score on regular days:
- Alternative Hypothesis ():
The hypothesis test for humidity is similar:
- Null Hypothesis (): mean exertion score on humid days is greater than the mean exertion score on regular days
- Alternative Hypothesis ():
How to Reject the Null Hypothesis
Given the objective is to reject the both of the aforementioned Null Hypotheses, the most common approach to doing so is to use an significance test. This statistical test will produce a test statistic and a p-value, from which we can use either to reject or accept the Null Hypothesis (p-value is derived from the test statistic).
Typically, the p-value (also referred to as the significance level) needs to be less than 0.05 to provide statistically significant evidence against the null hypothesis.
The diagram below visualises the confidence interval, rejection zones and the p-value.
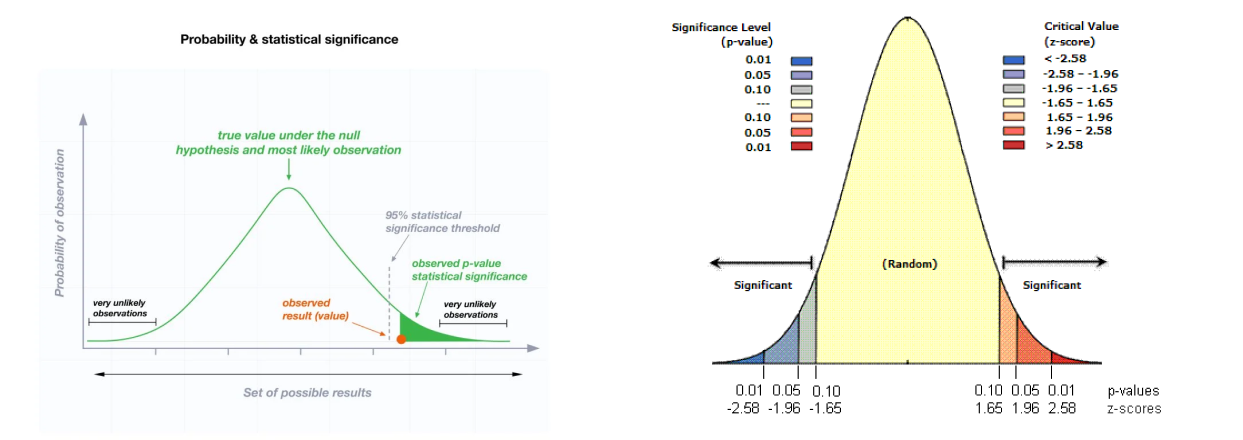
For more information on statistical significance and to view the left diagram, click here. To value the diagram on the left click here.
Selecting the appropriate Test Type
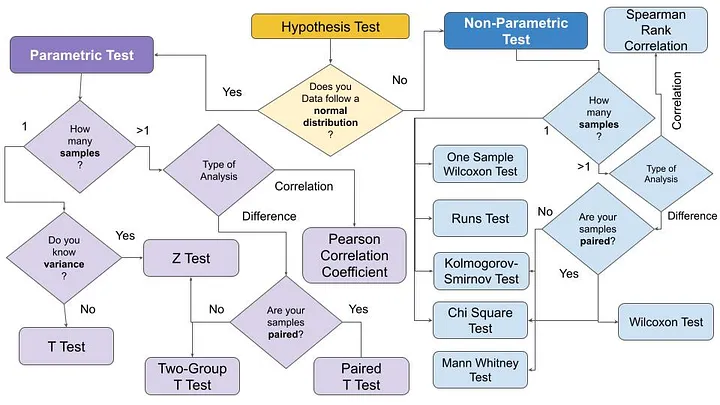
There are many different types of significance tests that can be used to calculate a p-value, most of which make certain assumptions and have certain requirements.
Angelica Lo Duca, wrote a great article on the decision process to decide between the available significance/hypothesis tests, which she summarised with the diagram below.
Are the Datasets Normally Distributed?
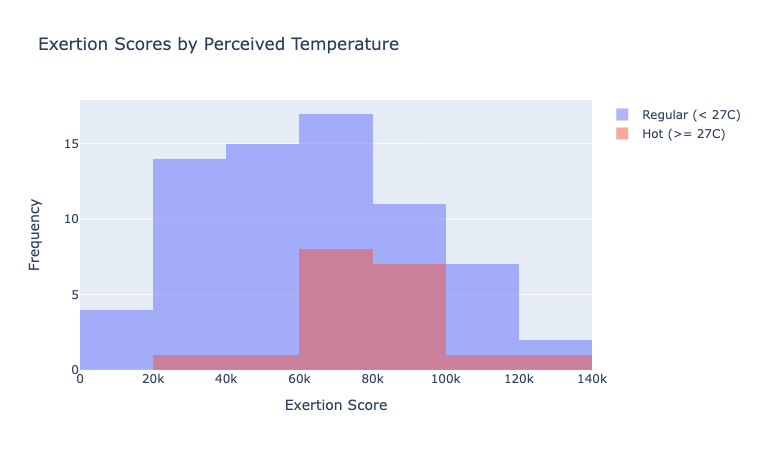
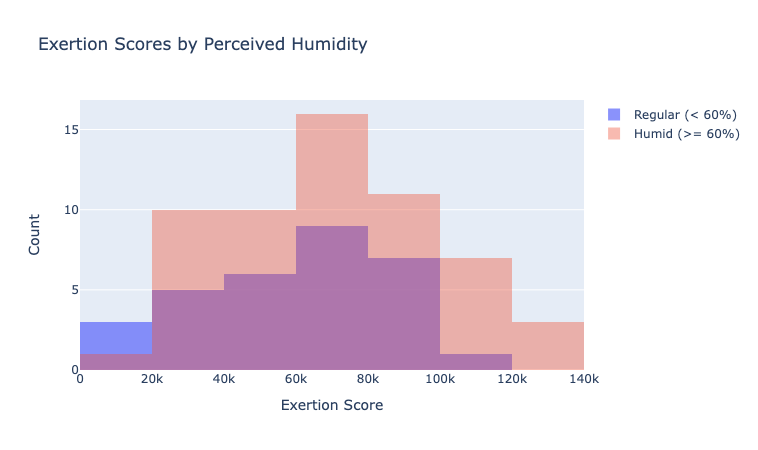
Using this decision framework, the first characteristic of the data that needs to be determined is “if it is normal distributed” (essentially a symmetric bell curve). From observing the data in a histogram form, it appears both datasets roughly follow a normal distribution.
However, to be another significance test called the “Shapiro Wilk Test” can be used to reject the null hypothesis of our data not being normally distributed. Using the shapiro() method scipy.stats provides produced the following results:
print(round(stats.shapiro(regular_temp_exertion_scores).pvalue, 4)) # 0.1306
print(round(stats.shapiro(hot_exertion_scores).pvalue, 4)) # 0.4763
print(round(stats.shapiro(regular_humidity_exertion_scores).pvalue, 4)) # 0.1492
print(round(stats.shapiro(humid_exertion_scores).pvalue, 4)) # 0.2161
Meaning for all our datasets, we can reject the null hypothesis that the data is not normally distributed. Therefore, we can assume the distribution is normal (despite the fact it could still be another distribution).
How many Sample Sets are there? Are they paired? Are they large?
Given our data is normally distributed and we have two sample sets for each experiment (sample 1.1: hot exertion scores, sample 1.2: regular exertion scores, sample 2.1: humid exertion scores, sample 2.2: regular humidity exertion scores), there are three options. That being a Two Group T-Test, a Paired T-Test or a Z-Test.
Neither dataset will use a Paired Test as the data is not paired, as workouts are done on distinct days with distinct temperatures/humidities.
For our temperature exertion score samples (1.1 and 1.2), the number of samples is 19 for the hot set and 70 for the regular temperature set. Since the size of the hot set is less than 30, which is what is considered the minimum size for a “large” sample, a Z-Test cannot be used.
However, for the humidity exertion score scores, the sizes are 31 (regular) and 58 (humid) respectively, hence the Z-Test will be selected.
Running the Hypothesis Tests
Now that the Null Hypothesis for the temperature and humidity experiments have been defined and the significance tests have been selected, the experiment can be run.
To do so I will be using the statsmodels Python package which provides methods for both T-Tests and Z-Tests.
Since statsmodels is an external package, it needs to be installed in your Python environment. If you are unsure about Python environments and how to set them up you can read my article on my portfolio blog here.
The first step is to activate your Python environment. Since I am using Miniconda to do this I enter conda activate *env-name* or if you are using a virtual environment you can enter source project_env_name/bin/activate.
Now that the environment is selected enter pip install statsmodels to install the package.
Using the following code snippets, the T-Test for the temperature experiment and the Z-Test for the humidity experiment can be run.
import statsmodelst_statistic, p_value, _ = statsmodels.stats.weightstats.ttest_ind(
regular_temp_exertion_scores,
hot_exertion_scores,
alternative="larger",
usevar="unequal",
)
print(f"Temperature Test Statistic: {round(t_statistic, 4)}")
print(f"Temperature P-Value: {round(p_value, 4)}\n")
# Output:
# Temperature Test Statistic: -3.0466
# Temperature P-Value: 0.998The P-Value = 0.9980 > 0.05, therefore we cannot reject the Null Hypothesis. Meaning that we do not significant evidence that the mean exertion score of workouts on regular days is greater than the mean of exertion score of workouts on hot days.
t_statistic, p_value = statsmodels.stats.weightstats.ztest(
    humid_exertion_scores,
    regular_humidity_exertion_scores,
    alternative="larger",
    usevar="unequal",
)
print(f"Temperature Test Statistic: {round(t_statistic, 4)}")
print(f"Temperature P-Value: {round(p_value, 4)}\n")

# Output:
# Temperature Test Statistic: -1.297
# Temperature P-Value: 0.9027
The P-Value = 0.9027 > 0.05, therefore we cannot reject the Null Hypothesis. Meaning that we do not significant evidence that the mean exertion score of workouts on regular days is greater than the mean of exertion score of workouts on humid days.
Possible Flaws in this Testing Methodology
Now that the conclusions of the above experiments have been reached, it is important to consider that this experiment and hypothesis testing in general can have flaws. For these experiments specifically this includes:
- Are the sample distributions normal? Specifically, the temperature exertion score distributions as they appear to be possibly bimodal?
- How are other factors impacting exertion score performance (workout type, duration etc)?
- For example, in Australia (where I live) autumn has only recently started. That means since I have been performing my best this year, the summer exertion scores for this year maybe skewing the distribution.
- Is the exertion score an accurate representation of workout performance?
- Has an appropriate temperature and humidity threshold been used to split the sample into two groups?
The last possible flaw is actually a well-known issue in significance tests called “P-Hacking”. Whereby, a scientist can misrepresent or skew results by intentionally manipulating data until they achieve a p-value that demonstrates statistical significance.
However, this wasn’t in case in this experiment as the desired hypothesis was not accepted.
Resources
Project GitHub Repository: https://github.com/LGXprod/environmental-workout-performance
If you found this article insightful or helpful, please consider leaving a clap and following me for more!